Flame Photometer: Principle, Components, Working Procedure, Applications, Advantages and Disadvantages
Posted on : 30-12-2017 Posted by : Admin

Introduction

During 1980s Bowling Barnes, David Richardson, John Berry and Robert Hood developed an instrument to measure the low concentrations of sodium and potassium in a solution. They named this instrument as Flame photometer. The principle of flame photometer is based on the measurement of the emitted light intensity when a metal is introduced into the flame. The wavelength of the colour gives information about the element and the colour of the flame gives information about the amount of the element present in the sample.

Flame photometry is one of the branches of atomic absorption spectroscopy. It is also known as flame emission spectroscopy. Currently, it has become a necessary tool in the field of analytical chemistry. Flame photometer can be used to determine the concentration of certain metal ions like sodium, potassium, lithium, calcium and cesium etc. In flame photometer spectra the metal ions are used in the form of atoms. The International Union of Pure and Applied Chemistry (IUPAC) Committee on Spectroscopic Nomenclature has named this technique as flame atomic emission spectrometry (FAES).


Principle of Flame photometer

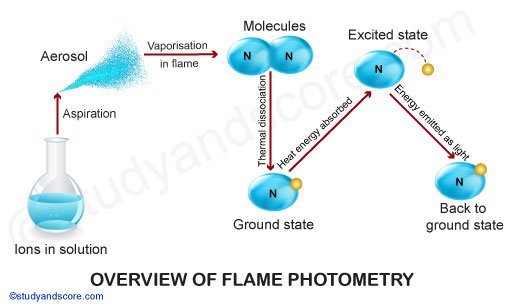
The compounds of the alkali and alkaline earth metals (Group II) dissociate into atoms when introduced into the flame. Some of these atoms further get excited to even higher levels. But these atoms are not stable at higher levels.

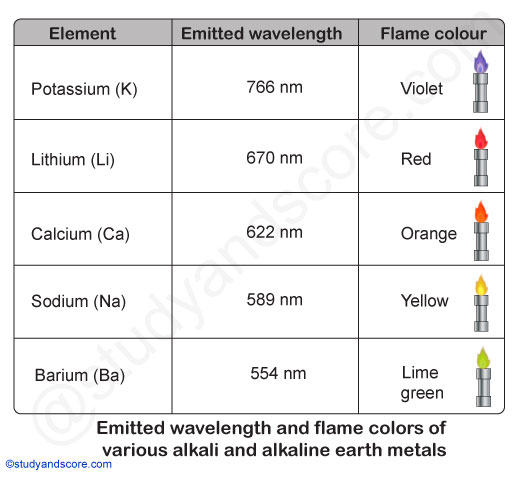
Hence, these atoms emit radiations when returning back to the ground state. These radiations generally lie in the visible region of the spectrum. Each of the alkali and alkaline earth metals has a specific wavelength.

Element Emitted wavelength Flame color
Sodium 589 nm Yellow
Potassium 766 nm Violet
Barium 554 nm Lime green
Calcium 622 nm Orange
Lithium 670 nm Red

For certain concentration ranges,

The intensity of the emission is directly proportional to the number of atoms returning to the ground state. And the light emitted is in turn proportional to the concentration of the sample.


Parts of flame photometer

A simple flame photometer consists of the following basic components:

Source of flame: A Burner in the flame photometer is the source of flame. It can be maintained in at a constant temperature. The temperature of the flame is one of the critical factors in flame photometry.

Fuel-Oxidant mixture Temperature (°C)
Natural gas-Air 1700
Propane-Air 1800
Hydrogen-Air 2000
Hydrogen-Oxygen 2650
Acetylene-Air 2300
Acetylene-Oxyen 3200
Acetylene-Nitrous oxide 2700
Cyanogen-Oxygen 4800

Nebuliser: Nebuliser is used to send homogeneous solution into the flame at a balanced rate.

Optical system: The optical system consists of convex mirror and convex lens. The convex mirror transmits the light emitted from the atoms. Convex mirror also helps to focus the emissions to the lens. The lens helps to focus the light on a point or slit.

Simple colour filters: The reflections from the mirror pass through the slit and reach the filters. Filters will isolate the wavelength to be measured from that of irrelevant emissions.

Photo-detector: The intensity of radiation emitted by the flame is measured by photo detector. Here the emitted radiation is converted to an electrical signal with the help of photo detector. These electrical signals are directly proportional to the intensity of light.

Flame Photometer Principle, Components, Working Procedure, Applications, Advantages And Disadvantages


Working procedure

  • Both the standard stock solution and sample solution are prepared in fresh distilled water.
  • The flame of the photometer is calibrated by adjusting the air and gas. Then the flame is allowed to stabilize for about 5 min.
  • Now the instrument is switched on and the lids of the filter chamber are opened to insert appropriate colour filters.
  • The readings of the galvanometer are adjusted to zero by spraying distilled water into the flame.
  • The sensitivity is adjusted by spraying the most concentrated standard working solution into the flame. Now the full scale deflection of the galvanometer is recorded.
  • Again distilled water is sprayed into the flame to attain constant readings of galvanometer. Then the galvanometer is readjusted to zero.
  • Now each of the standard working solutions is sprayed into the flame for three times and the readings of galvanometer are recorded. After each spray, the apparatus must be thoroughly washed.
  • Finally sample solution is sprayed into the flame for three times and the readings of galvanometer are recorded. After each spray, the apparatus must be thoroughly washed.
  • Calculate the mean of the galvanometer reading.
  • Plot the graph of concentration against the galvanometer reading to find out the concentration of the element in the sample.

Flame Photometer graph, flame photometer readings, galvanometer readings, sample concentration

overview of Flame Photometer

  • The solvent is first aspirated to obtain fine solid particles.
  • These molecules in the solid particles are moved towards the flame to produce gaseous atoms and ions.
  • These ions absorb the energy from the flame get excited to high energy levels from the ground state.
  • But as these ions are unstable, they return back to ground state. While returning they emit characteristic radiation.
  • The intensity of emitted light is proportional to the concentration of the element.

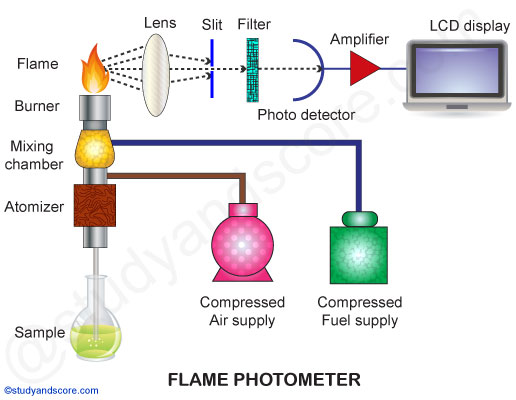
The oxidants in flame photometer are mainly air, oxygen or nitrous oxide. The temperature of the flame depends on the ratio of fuel and oxidant.

The processes occurring during flame photometer analysis are summarized below:

Desolvation: Desolvation involves drying a sample in a solution. The metal particles in the solvent are dehydrated by the flame and thus solvent is evaporated.

Vaporization: The metal particles in the sample are also dehydrated. This also led to the evaporation of the solvent.

Atomization: Atomization is the separation of all atoms in a chemical substance. The metal ions in the sample are reduced to metal atoms by the flame.

Excitation: The electrostatic force of attraction between the electrons and nucleus of the atom helps them to absorb a particular amount of energy. The atoms then jump to the higher energy state when excited.

Emission: Since the higher energy state is unstable the atoms jump back to the ground state or low energy state to gain stability. This jumping of atoms emits radiation with characteristic wavelength. The radiation is measured by the photo detector.


Scheibe-Lomakin equation

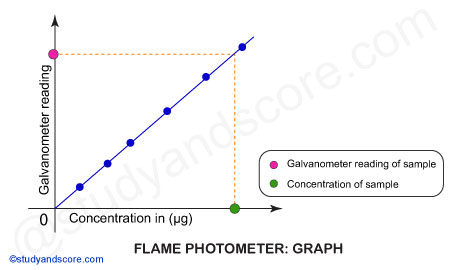
Scheibe-Lomakin equation describes intensity of light emitted with the help of following formula:

I = k × cn

Where:
I = Intensity of emitted light
c = Concentration of the element
k = Proportionality constant

At the linear part of the calibration curve n~1,

then I = k × c. In other words, the intensity of emitted light is directly related to the concentration of the sample.

emitted  wavelength and flame colors of alkali and alkaline earth metals, flame color chart


Applications of flame photometer

  1. Flame photometer can be applied both for quantitative and qualitative analysis of elements. The radiations emitted by the flame photometer are characteristic to particular metal. Hence with the help of Flame photometer we can detect the presence of any specific element in the given sample.
  2. The presence of some group II elements is critical for soil health. We can determine the presence of various alkali and alkaline earth metals in soil sample by conducting flame test and then the soil can be supplied with specific fertiliser.
  3. The concentrations of Na+ and K+ ions are very important in the human body for conducting various metabolic functions. Their concentrations can be determined by diluting and aspirating blood serum sample into the flame. 
  4. Soft drinks, fruit juices and alcoholic beverages can also be analysed by using flame photometry to determine the concentrations of various metals and elements.


Advantages of flame photometer

  1. The method of analysis is very simple and economical.
  2. It is quick, convenient, selective and sensitive analysis.
  3. It is both and qualitative and quantitative in nature.
  4. Even very low concentrations (parts per million/ppm to parts per billion/ppb range) of metals in the sample can be determined.
  5. This method compensates for any unexpected interfering material present in the sample solution.
  6. This method can be used to estimate elements which are rarely analysed.


Disadvantages of flame photometer

  1. In spite of many advantages, this analysis technique has quite a few disadvantages:
  2. The accurate concentration of the metal ion in the solution cannot be measured.
  3. It cannot directly detect and determine the presence of inert gases.
  4. Though this technique measures the total metal content present in the sample, it does not provide the information about the molecular structure of the metal present in the sample.
  5. Only liquid samples may be used. Also sample preparation becomes lengthy in some cases.
  6. Flame photometry cannot be used for the direct determination of each and every metal atom. A number of metal atoms cannot be analysed by this method. The elements such as carbon, hydrogen and halides cannot be detected due to their non-radiating nature.


- Share with your friends! -

Comments

  • Saud Malik on Mar 15, 2018 at 08:10 pm

    Its very informative.... i prepared this topic for exam...My paper is on monday ..pray for me ..nd thanx for such a extraordinary topic

    Reply

    • Study Score on Mar 17, 2018 at 06:51 pm

      Thank you Saud Malik. All the best for your exam.

      Reply

  • sumit shinde on Mar 02, 2018 at 07:28 am

    Very very useful information. I really thank you.

    Reply

    • Study Score on Mar 02, 2018 at 02:36 pm

      Thank you Sumit.

      Reply

  • Bhatt Eshfaq on Apr 20, 2018 at 11:23 am

    This topic is very informative. I Like the way you represent it and I prepared it for my Exams. Thanks a lot...

    Reply

    • Study Score on Apr 20, 2018 at 05:20 pm

      Thank you Bhatt Eshfaq. All the best for your exam.

      Reply

  • Himabindu Malla on Jun 29, 2018 at 06:00 pm

    The manner in which the article is written and explained by using a diagram is awesome and very helpful.

    Reply

    • Study Score on Jul 02, 2018 at 10:17 am

      Thank you Himabindu. Do explore all other articles on our website.

      Reply

  • Afaq Basra on Dec 02, 2018 at 09:25 am

    hi, admin please share the name of the publisher/writer?

    Reply

  • nikhil kumar rajwade on Aug 28, 2019 at 11:37 pm

    how to download link to overwive

    Reply

  • Fazal  Khan on Oct 18, 2019 at 08:31 am

    So helpful

    Reply

  • Dipankar Ghosh on Oct 03, 2020 at 10:15 am

    It's helpful and good notes for exam

    Reply